EXCEL 2007: Two-Variable Regression Using Data Analysis Add-in
A. Colin Cameron, Dept. of Economics, Univ. of
Calif.
- Davis
This January 2009 help sheet gives information on
- Two-variable linear regression.
- Run the regression using the Data Analysis Add-in.
- Interpreting the regression summary output (but not performing
statistical inference).
This handout is the first place to go to for two-variable regression
output.
After reading this move onto Excel 2007:
Statistical
Inference for Two-Variable Regression
Other ways to do two-variable regression are discussed
in Excel 2007: Two-way Plots in the
section on
Add a trendline and
in Excel 2007: Two Variable
Regression using Functions LINEST
TWO-VARIABLE LINEAR REGRESSION
The population regression model is: y = β1
+ β2 x + u
We wish to estimate the regression line: y =
b1 + b2 x
REGRESSION USING THE DATA ANALYSIS ADD-IN
This requires the Data Analysis Add-in: see Excel 2007: Access and Activating the
Data Analysis Add-in
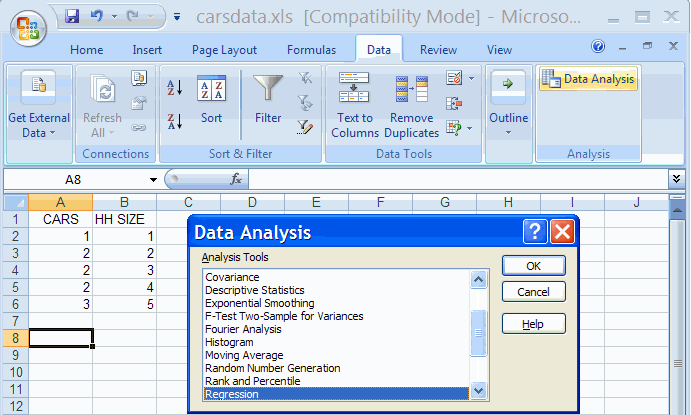
The data used are in carsdata.xls
- In the Data Group select the Data Analysis Add-in
- Select Regression Analysis

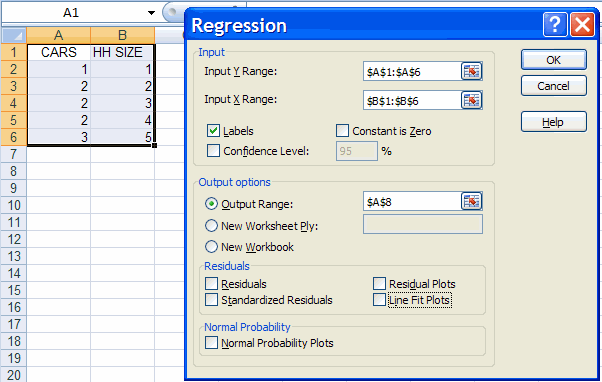
We select OK and fill out the dialog box as follows

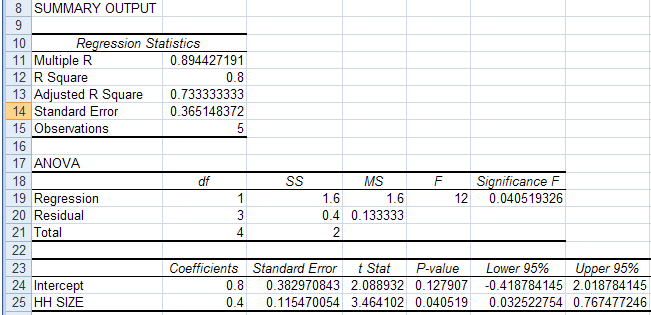
We obtain

INTERPRETING THE REGRESSION SUMMARY OUTPUT
The key output is given in the Coefficients column in the last set
of output:
- b1 = 0.8 (the Intercept
coefficient)
- b2 = 0.4 (the Coefficient of
HH SIZE : the slope coefficient)
Thus the fitted line is: y = 0.8 + 0.4 x
or
CARS = 0.8 + 0.4 HHSIZE
The regression statistics outyput gives measures of how well the
model fits the data. In particular
- R2 = 0.8 which measures the fit of the
model
This means that 80%
of
the variation of yi around ybar is explained by the
regressor xi
- Standard error = 0.365 which measures the standard deviation of yi
around its fitted value.
The remaining output (ANOVA table and t Stat, p-value, .... ) is used
for statistical inference.
See Excel
2007: Statistical
Inference for Two-Variable Regression
For further information on how to use Excel go to
http://cameron.econ.ucdavis.edu/excel/excel.html


